1 Graphs Everywhere!
If you have ever been lucky enough to pay a visit to the vibrant city of Kaliningrad on the Baltic coast, it’s likely to have been a trip you remember. An unusual exclave of the massive Russian Federation, you cannot get to the remainder of Russia from Kaliningrad over land without crossing through at least two other countries. Things have landed this way, like they always do, because of the cards dealt by history. The strategic importance endowed to Kaliningrad owing to its prime coastal position placed it in the center of a geopolitical ‘tug-of-war’ which saw it change hands on numerous occasions over the centuries. By the end of the Second World War, as Stalin cast his eye over the ruins of Europe, he considered the city far too strategically important to be left in the hands of any other Eastern Bloc state, and so—despite the physical separation—it was duly deemed to be Russia’s sovereign territory.
As you might expect, Kaliningrad has only been so named since it became part of the USSR in 1946. Prior to this, and stretching back to the Middle Ages, it was known as Königsberg—the King’s Mountain—in honor of King Ottokar II of Bohemia (c.1233-1278). Steeped in glorious and tragic history, the city is rich in museums, castles, cathedrals and monuments from its past. But for mathematicians like me, Königsberg is perhaps best known for a simple, unassuming puzzle that occupied the minds of many a renaissance intellectual in the 17th and 18th centuries—a problem which, it could be argued, laid the foundations for the highly connected world we live in today.
1.1 The Seven Bridges of Königsberg
The city once known as Königsberg is separated in two by the path of the Pregel River. As the Pregel breaks toward the Baltic Sea, two islands form a part of the city. This leads to a city comprised of four land masses: the two mainland masses on either side of the river (known as Altstadt-Loebenicht and Vorstadt-Haberberg), and the two island land masses (Lomse and Kneiphof). In the 1700s, a total of seven bridges connected these land masses9. Figure 1.1 is a suitably historic map of the situation. The island on the left is Kneiphof and the island on the right is Lomse. The beautiful dress worn by the lady in the foreground of this picture is large enough so that one of the seven bridges is entirely covered by it, but you can see the other six.
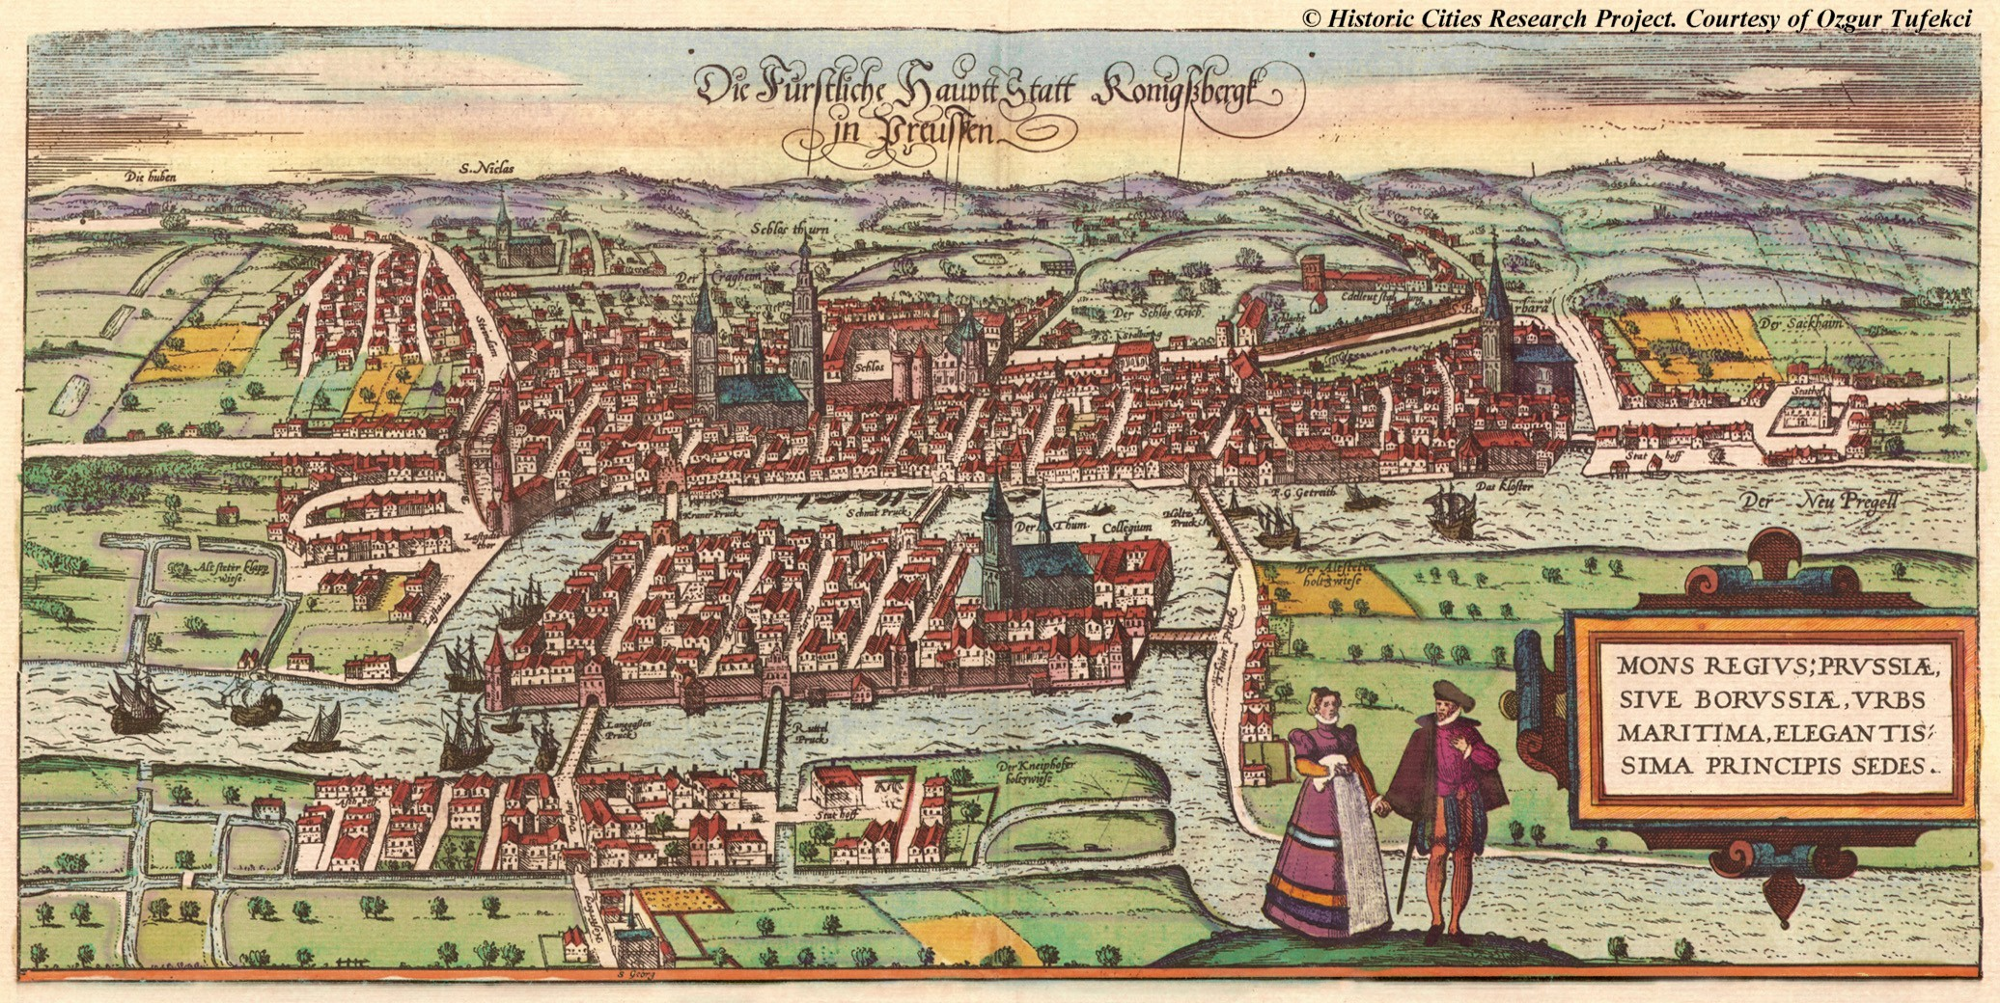
Figure 1.1: The Prussian city of Königsberg circa 1600 from Civitates Orbis Terrarum, Vol.III (credit: Historic Cities Research Project)
The puzzle went like this: is it possible to devise a walk where you would set foot on all four land masses while crossing all seven bridges only once? There was a strong hunch from trial and error that the answer was no—the problem was how to prove this mathematically. No effective techniques had yet been discovered to allow such a proof.
Enter Leonhard Euler, an 18th century Swiss mathematician who spent the majority of his life in St. Petersburg and Berlin. A prolific original thinker, Euler is considered by many as the greatest mathematician of all time. It is impossible to study mathematics even at high school without being constantly exposed to Euler’s work. He popularized the greek letter \(\pi\) to denote Archimedes’ constant ratio between the circumference and diameter of a circle. He formalized the letter \(i\) to denote the imaginary number \(\sqrt{-1}\) and he defined the exponential constant \(e\) which is known as Euler’s number. Living between two cities on either side of Königsberg at the time of the problem of the seven bridges, he set about finding a solution. The one he discovered is both a testament to the beauty of mathematical proof and the first use of the concept of a graph to solve a mathematical problem.
The first thing Euler did—as any good mathematician will always do—is strip the problem of all its extraneous information and reduce it to its most minimal form. The problem merely requires one to set foot on a land mass. It is not concerned with what route one takes while on that land mass. Therefore, we can represent each of the four land masses as dots. We can then draw lines between the dots to represent the bridges. This, he reasoned, leads to a diagram like that in Interactive Figure 1.2. The picture can be drawn in infinitely many ways, but it will always be four dots connected by seven lines in the same configuration. If you like, move the nodes around to see what I mean.
Figure 1.2: A minimal representation of the Seven Bridges of Königsberg problem
First, Euler observed that if one starts their journey at a certain place and crosses all seven bridges once, there must have been eight total visits to places. This is because we start at a place, and every time we cross a bridge, we add another place to our walk. So if we cross seven bridges, we must visit eight places (including repeat visits to a place).
Euler then looked at any situation where you have a place \(P\) connected to other places by an odd number of bridges. If there was one bridge and it was crossed once, we would only be in place \(P\) once—either at the beginning or end of the journey. If there were three bridges and all were crossed once, place \(P\) would have been visited twice no matter where we started. If there were five bridges, place \(P\) would have been visited three times. If there were \(n\) bridges, place \(P\) would have been visited \(\frac{1}{2}(n+1)\) times.
Now Euler calculated how many place visits this would mean in total for Königsberg. Since Kneiphof has five bridges to other places, if all were crossed once Kneiphof would have been visited three times. The other three places each have three bridges connecting them, so any such walk would result in two visits to each place. Adding all this up, this means that if a walk existed through all four places where every bridge was used only once, there must be nine total place visits. Since this contradicts Euler’s earlier observation that such a walk must involve only eight place visits, we must conclude that such a walk does not exist.
Euler’s proof was the first time a graph like the one in Interactive Figure 1.2 was used to solve a problem. The solution also involved concepts that would later become critical in the study of graphs. Euler set up the places as vertices or nodes of the graph, and he set up the bridges as edges. The proof depends on a conclusion about the number of edges connected to a vertex, which later became known as the degree of a vertex. The proof required the study of walks or paths through the graph. The requirement that a walk could only use each edge once became known as an Euler walk (or Eulerian path) and various algorithms exist today to calculate Euler walks for problems such as constructing DNA sequences from their fragments10. Little was Euler to know the Pandora’s Box he had opened.
Thinking ahead: If you know how to load a graph object into R or Python, you could try to load the koenigsberg data set from the onadata package or download it from the internet11 and create a graph from it. You could use your software to calculate the degrees of the vertices of the graph. For example in R, if you have the data loaded into an igraph object, you can use igraph::degree() to get a vector showing you the degrees of each vertex. There is even a package called eulerian in R which has a function hasEulerianPath() which determines whether an Euler walk exists in a given graph.
1.2 Graphs as mathematical models
Graphs and networks have existed long before Euler, and probably since the beginning of time itself. They exist physically, such as in a spider’s web, in the electrical wiring of your home or in the molecules that make up the universe. Since the time of Euler, graphs have also existed conceptually as the best way we can describe many complex systems, and in this book we will focus on the use of graphs to describe systems related to people, groups, organizations or other similar societal constructs. Before we jump into our core topic, it is worth taking a few moments to appreciate how fundamental graphs are to both science and to everyday life by discussing a few examples of the practical use of graphs to solve problems.
Whenever objects move physically through a network structure, it makes sense that graph theory will be of great use in solving problems of routing and optimization. An obvious example of this is whenever a route is planned on Google or Apple Maps, or on a SatNav system. When you search a driving route to a given destination, the underlying calculation involves streets and roads as edges and intersections as vertices. The fastest routes are calculated based on stored properties of the edges such as the road length, road speed limit and live traffic information. The underlying graphs are updated over time with edges switched on and off according to information on road closures12. It doesn’t just have to be road networks of course. Rail, air and other forms of transport networks make great use of graph theory. Maybe you are sitting on a train while reading this book and, if you are, have a look around you for the route map and you’ll see a graph right there. Essential public services such as the management of sewerage networks are an example of one of the less glamorous fields where graph theory is essential to operational calculations and decisions. If there is a sudden cold snap in a city and roads need to be de-iced, the problem of how to get around the city in an efficient way, saving resources by minimizing the route while still covering all critical areas sounds like a puzzle Euler himself would have loved.
Nowadays, objects that move through networks are often electronic in nature, such as bytes of code or electrical currents. National and local power grids are managed with the help of graph theory. Communications networks, telephone, satellite, cable and internet are all networks where nodes are connection points such as junctions or receiver points and edges can be visible in the form of underground or undersea cables or invisible in the form of signals sent through the air or into space.
In the sciences, graphs are essential as models of biological, chemical or physical processes or phenomena. Chemical Graph Theory (CGT) deals with the applications of graph theory to molecular problems. In condensed matter physics, graph theory is essential in quantitatively modeling atomic structures. In biology and biochemistry, graphs are important in understanding the spread of disease in epidemic models, in the study of genomics and DNA, in the neuroscientific modeling of brain functioning and in the ecological modeling of species migration. In the computational sciences, huge progress has been made in the storing of data thanks to databases that have a graph-like structure, and many of the latest algorithms used in Machine Learning operate through graph-like structures like trees or neural networks. In linguistics, graphs have facilitated great advances in how we understand natural language as a collection of discrete words and phrases that are related to each other. The list goes on and on.
Arguably, the area where graphs have impacted our daily lives the most in recent decades is in the development of online communities which depend on them. Social networks like Facebook, Twitter, LinkedIn, Instagram and many others use graphs to connect people in ways that have fundamentally changed lives and livelihoods. Friendships and acquaintances happen today between people who have never and often will never meet physically. Countless relationships, marriages and families have been brought into existence. Long lost families separated by adoption or abandonment have found each other again. Job opportunities have been created and filled. Individuals with common interests have been connected irrelevant of where they are located. The positives and negatives of this rapid and paradigm-shifting rise in social networking are vigorously debated, but what cannot be denied is that they would not exist without graph theory.
1.3 Graph theory in the analysis of people and groups
In the social sciences and in the study of people and groups, the increasing prevalence of network data and the ability to analyze it using graph-theoretic methods have opened up rich and continuously developing veins of research that encompass both academic and enterprise settings. Much of the work that is done can be grouped into a few different study areas.
1.3.1 The study of connection
In most organizations, institutions and societal groups, connection is considered a critical facilitator of happiness, motivation, productivity and progress. The psychological concept of belongingness, which describes a human need to connect, affiliate and be accepted by others, is an important element of Maslow’s Hierarchy of Needs. Empirically, greater social connection has been associated with positive effects on mental and physical health, cognitive functioning, life expectancy and even wound healing (Holt-Lunstad (2018)). Conversely, lack of connection—or loneliness—is of research interest because of its potential negative effects on mental well-being, productivity and workplace performance. A meta-analytic review of the relationship between social relationships and mortality risk concluded that lack of social connection carries a higher risk of premature mortality than obesity (Holt-Lunstad et al. (2015)). In workplace settings, practitioners and academics are showing an increasing amount of interest in connection and how it affects performance, productivity and employee retention. Empirical research has demonstrated links between friendship at work and improved work engagement and productivity (Rath (2006)), and social interaction at work (whether work-related or otherwise) has been associated with improved outcomes (Olguin et al. (2009)).
The ability to analyze connection in the workplace and in society-at-large will become increasingly important as we move further into the 21st century. The variety of data that could represent connection is expanding. Connection between people can now be defined by in-person interaction, electronic transaction and even assumed connection through overlaps in geographic location or in work or personal activities. Strong analytic techniques will be necessary to support evidence-based practice, because not all measures of connection are meaningful to the outcomes being researched and, even when they have been shown to be meaningful, resulting interventions do not always have the expected effects (for example, a study by Feld & Carter (1998) demonstrated that deliberate attempts to increase interracial contact in American schools actually ended up causing greater racial segregation).
1.3.2 The study of information flow
General fascination with how information propagates through networks dates from the earliest chain letters in the late 19th century (Solly (2020)). Those of us who are old enough may remember receiving letters in the mail asking to send the message onward to a specified number of individuals, and promising that this will generate thousands of replies within a few weeks. Figure 1.3 is an example of one of these letters used as a way to generate money in Texas in 1935.
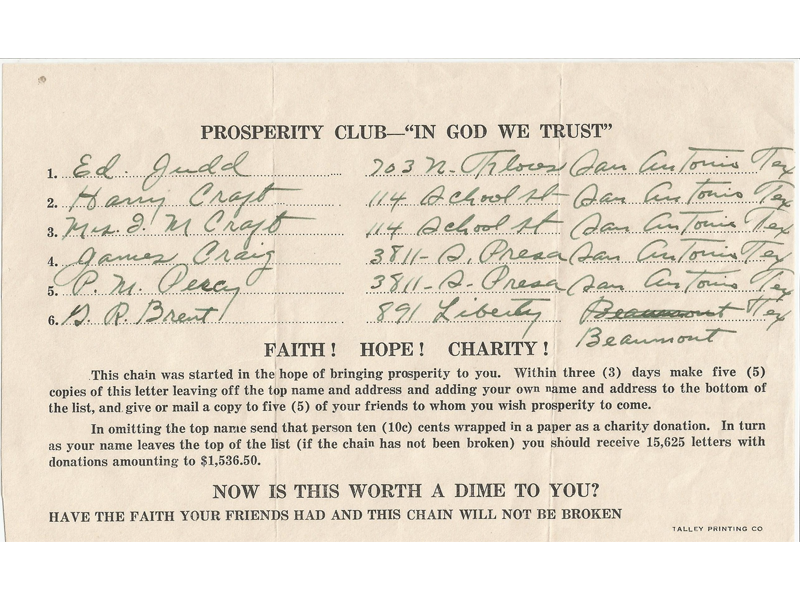
Figure 1.3: Chain letter from Texas in 1935 (credit: Daniel W. VanArsdale)
More recently, information flow between people has been fundamentally transformed by the digital age, with potential reach and speed of transmission massively enabled by technology. Today, the study of the propagation of information in networks has many purposes including the development of emergency alert strategies, the prevention of fraudulent activities, the defense of public health or the protection of the integrity of criminal justice processes. Although this area of research is still in its infancy, models which are not dissimilar to those used in biology and epidemiology are employed (for example, Hafnaoui et al. (2019)). The likelihood of messages propagating can depend on the characteristics of the network, the nature of the message and the node which is propagating it (popularity, credibility), and the receptiveness of the onward nodes to the message. The term ‘viral’ has entered our lexicon to describe rapid electronic message propagation in the last decade or so. The effect of message propagation on the development of networks is also of great research interest—for example, what nature and frequency of message propagation leads to rapid network growth?
Currently, research of this nature is mostly confined to academics working with social media data, but there is substantial value to be gained from its application in workforce settings. An increasingly distributed workforce with lower levels of geographic concentration will mean that organizations will need to more effectively manage important, urgent or time-sensitive communication with their workforce and this will require greater intelligence on how information propagates effectively and efficiently in their specific environments.
1.3.3 The study of community, diversity and familiarity
Distance in a network—which we will define more precisely in later chapters—can be representative of likely similarity or familiarity (or lack thereof) between individuals, which allows for mathematical models to support the study of community and diversity. Algorithms for calculating distance and diameter in a network help determine how ‘tight’ groups are and allow some measurement of inter- and intra-group interaction. Community detection algorithms involve graph partitioning to help identify ‘pockets’ of highly connected individuals in large networks. This is of great interest in the field of sociology, but also it applications in other areas such as the study of common purchasing behaviors among customers, and the study of common interests among academics or writers (Lu et al. (2018)).
Increasing focus on diversity as a positive influencer of organizational outcomes in recent years means that the ability to measure distance and identify community structures in networks will be of high utility, particularly in complex organizational contexts. Use cases can range from highly strategic questions of organizational design to highly tactical questions of meeting attendance or group membership. Current trends away from physical co-location of employees and the rise of more virtual organizational structures will likely result in greater requirements for analysis of remote and electronic interaction in order to determine whether imposed structures genuinely reflect the way people work. Effective use of these techniques can even be valuable in the coordination of large professional or social events, where subgroups can be identified to maximize in-group distance in order to better ensure a more diverse mix of employees in professional or social activities.
1.3.4 The study of importance, influence and attachment
While the concept of vertex/node importance or centrality has been a fundamental tenet of graph theory for a long time, the rise of social networks seems to have turbo-charged its relevance in research and analytics. The rise of the ‘influencer’ as a highly connected and influential member of a network has entered deeply into social consciousness in the past decade, and the study of how followership is generated through the forming of attachments between members of networks is one of the more rich veins of sociological research currently. The idea of preferential attachment or the Matthew Effect describes an accumulated advantage over time, where those with more attachment attract yet more13. It has been believed that social networks show similar properties to scale-free networks which obey a power law distribution of the degree of their vertices/nodes; see Figure 1.4.14 In fact, the most recent research indicates that scale-free networks exist rarely and that social networks are at best weakly scale-free (Broido & Clauset (2019)), or may not exhibit any notable preferential attachment behavior at all (Fisher et al. (2017)).

Figure 1.4: Power law distribution of vertex degrees in a scale-free network for \(\alpha = 2\), showing a mass concentration toward low-degree vertices and an exclusive tail of vertices with high degree. This has been believed to be a consequence of preferential attachment in networks.
Of course, any organization, institution or place of work can be considered a social network and there will be individuals that command greater or less attachment according to their tenure, seniority, skills or general popularity. Understanding this in an organizational context can lead to insights about leadership and followership and help us better determine the influence of followership on recruitment and attrition. Different types of centrality such as degree, betweenness, closeness and eigenvector centrality can imply different roles of individuals in terms of their importance and influence in their network.
Thinking ahead: If you know how to, load up the graph of Zachary’s Karate Club via the karate data set in the onadata package or by downloading the edgelist from the internet15. See if you can find some functions to calculate the degree centrality, betweenness centrality, closeness centrality and eigenvector centrality of the various individuals in the network. If you compare the results, you should discover that centrality can mean different things depending on how you define it.
1.3.5 Graphs as data sources
As use cases for network analytics mature, and as more and more organizations seek to understand their networks better, traditional rectangular-style databases will become increasingly challenging to work with. Consider a desire to analyze whether two salespeople in an organization are connected through serving the same customer in the same month. Depending on how data is currently stored in systems, this could easily end up being a lot more complicated and computationally expensive than it needs to be. Sales records may need to be joined to customer records, which may then need to be rejoined back to sales data. This may need to be done repeatedly to eventually obtain the required view of the data. Traditional rectangular databases are stored to keep records of transactions, not of connections.
Many organizations are turning to graph databases to store data about relationships and to allow much faster query and calculation whenever the unit of analysis is connection. A graph database is designed to store information about connected objects like people or organizational units in its vertices, and information about relationships in its edges. Such databases suit data that already comes in the form of a graph edgelist such as information on communication or interaction, but it is also becoming more common to transform other forms of data to be loaded into a graph database in order to query relationships that are otherwise not easy to see16. Social media engines and many knowledge-based resources like Wikipedia are supported by graph databases, and these sorts of databases are also becoming more commonly found in enterprise settings. They have helped solve some high-profile problems. For example, the International Consortium of Investigative Journalists (ICIJ) used a graph database to load document metadata from the Panama Papers document leak. Stored in this format the metadata exposed various complex networks of offshore tax arrangements.
All of the topics mentioned above will come up to a greater or lesser degree in the content of this book, and from time to time there will even be diversions into a few other use cases outside of the people analytics domain in order to help illustrate the broader applications of methods. As this book is intended to be more of a technical manual than a work of philosophy, we will be coming at this entire topic from the point of view of methodology and we will be focusing more on the how than the why. That said, some of the examples we use will clearly point to the motivation of the analysis and how each methodology can be useful in practice. As enthusiastic readers progress through the technical material and work through the examples chapter by chapter, I expect that they will quickly grasp the potential for application of these methods in their work or study.
1.4 Purpose, structure and organization of this book
This book is targeted at technical practitioners who need a thorough grounding in the storage, visualization and analysis of network data. It requires an elementary knowledge of the R or Python programming languages. As I am first and foremost an R programmer, most of the content of this book will be primarily demonstrated in R, but efforts have been made to ensure that Python implementations have been demonstrated wherever possible, albeit more briefly in most places. If you are a Python programmer, I would recommend that you are open to reading the sections that use R code as they will often help you build a better understanding of the work through the more thorough descriptions and discussions contained therein. If you have never programmed before, I have included an introductory section on the R programming language to get you started. This is similar to an introductory chapter in my previous book (McNulty (2021)).
If you are not a technical practitioner, this book can still be useful to you, as it contains considerable detail on concepts, methods and use cases related to network analytics in organizations, and it gives guidance on the interpretation of network analysis and statistics. You will just need to be willing to tolerate the various code blocks that will appear as part of the technical instruction.
Various downloadable data sets are used throughout this book, and in some cases I point to other sources of data outside the book for those who are interested in further exploration, particularly of very large network data. Data sets are introduced and described at various points as they are used, and many of them are used multiple times in the book to illustrate different methodologies.
Most chapters end with a set of discussion questions and data exercises, and I strongly encourage the reader to engage with these in order to put their learning into practice. Often, it is through taking on these exercises that readers discover some of the common pitfalls of working with graph data structures, and better to learn these pitfalls now than to find out about them in high-stakes or more urgent situations.
Readers will have already noticed the ‘blue boxes’ that appear in this chapter, and they will be a regular feature throughout this book. They are optional, and generally encourage readers to ‘think ahead’ or ‘play around’ with some of the ideas or methods introduced. These blue boxes are intended to make the book more fun and to encourage experimentation as a way of learning, especially for more competent technical practitioners. Occasionally, they try to thread together related concepts that appear in different chapters of the book, so that readers can get a better sense of how some of the theory and methodology fit together.
This chapter can be considered preliminary. From Chapter 2 onward, this book takes the following structure:
- Chapter 2 introduces the simple elements of graph theory including how to define a graph, types of graphs, vertex and edge properties and the ways in which a graph can be described mathematically. It then proceeds to demonstrate how to create graph objects in R or in Python and how to start working with them.
- Chapter 3 looks at the various options for how to visualize graphs in R and in Python. It goes through a variety of technical options for static and dynamic visualizations of graphs and how to customize the appearance of graphs for various purposes.
- Chapter 4 looks at how data can be transformed to be used in a graph structure, which is an important workflow element in making graphs useful for analysis. Two substantial examples are used to illustrate how to transform rectangular data into an edgelist for a graph and how to scrape document information for use in graphs.
- Chapter 5 examines the topic of paths and distance in graphs, introduces related concepts such as graph diameter, and demonstrates some common methods such as Dijkstra’s shortest path algorithm. The utility of these concepts is illustrated through two examples: facilitating workplace introductions and generating diverse employee groupings.
- Chapter 6 examines the topic of vertex importance and centrality in graphs. It discusses different types of centrality and their meaning and usefulness in a network analytics context, and it shows various methods for calculating and graphically illustrating centrality in graphs. These metrics are then put to use on an example network of office workers.
- Chapter 7 looks at community and clique detection. It covers various options for how to identify communities in graphs, how to describe communities and how to illustrate them effectively. A high school network and a Twitter network of politicians are used to illustrate how to detect communities and how to describe them using ground truth network properties.
- Chapter 8 deep dives into some common statistics used in analyzing networks, in particular related to similarity, assortativity and attachment.
- Chapter 9 introduces the concept of graphs as databases and provides some examples of how to design and use graph databases for the purpose of network analytics. Examples include how to query the open access Wikidata knowledge graph and how to work with a Neo4J graph database natively and via R and Python. This can be considered an extension chapter for those who are interested.
References
Only two of these bridges still survive today↩︎
In fact, Euler extended his proof to consider any graph and concluded that if an Euler walk exists in a graph, then the number of vertices with odd degree is either 0 or 2. For a fascinating write-up of Euler’s original proof, see Paoletti (2006)↩︎
Such networks are known as temporal networks.↩︎
So named because of a segment of the Gospel of Matthew in the New Testament: “For to every one who has will more be given, and he will have abundance; but from him who has not, even what he has will be taken away.”↩︎
In a scale-free network, the proportion of vertices/nodes of degree \(k\) takes a shape similar to \(k^{-\alpha}\) where usually \(2 < \alpha < 3\).↩︎
We will look at examples of how to do this in Chapter 4 of this book.↩︎